Smart lock production capacity is the first operational KPI a procurement manager should verify when evaluating a manufacturing partner. It determines whether a supplier can scale with your brand, absorb volume surges, and keep lead times stable across large-scale deployments.
For OEM/ODM buyers and hardware distributors, raw output numbers are only half the story. What matters is the infrastructure behind those numbers — automated lines, PCBA lead times, and quality systems — and how they translate into reliable supply for hotels, property developers, or retail channels.
Key Metrics for Evaluating Smart Lock Manufacturing Output
Production capacity is measured by the maximum sustainable output a facility can maintain under normal operating conditions. We track it through a set of interdependent metrics rather than one headline number.
- Annual production capacity: Expressed in units per year, this benchmark helps buyers assess long-term partnership potential. In the smart lock industry, mid-tier factories may target 300,000–800,000 units annually, while high-volume hubs in China often exceed 3 million units.
- Monthly unit capacity: This matters for order scheduling and surge planning. A factory quoting 50,000 units per month may still struggle with a 45,000-unit spike if PCBA cycles are not staggered correctly. Always compare monthly figures against current backlog.
- Number of active production lines: Parallel lines allow simultaneous builds of different models, reducing cross-contamination of SKUs and absorbing peak demand. More lines do not always mean higher output, though; line efficiency, yield, and changeover time are just as important.
- Factory footprint: Total square meters gives a rough capacity proxy, but layout and automation density matter more. A 10,000 m² plant with lean flow and in-house SMT can outperform a 20,000 m² facility built on manual assembly.
Global Benchmarks: Capacity Tiers in the Smart Lock Industry
Smart lock manufacturers generally fall into three operational tiers based on factory scale, automation level, and target buyer profile. Understanding these tiers helps buyers set realistic expectations for MOQ, customization, and lead time.
| Tier | Annual Capacity | Typical Factory Size | Production Lines | Region Example |
|---|---|---|---|---|
| Tier 1: High Volume | 3M+ units | 20,000–50,000 m² | 10–25+ | Guangdong, China |
| Tier 2: Mid-Size | 500,000–2M units | 8,000–20,000 m² | 5–12 | India, Vietnam |
| Tier 3: Specialized | Under 500,000 units | 2,000–8,000 m² | 2–6 | Europe, boutique ODM |
Note: These are industry benchmark ranges. Actual output depends on product complexity, automation, and shift models. Always verify current capacity with the factory.
A smart lock factory in China at Tier 1 scale typically runs high-speed SMT lines and dedicated assembly cells for multiple brands. In contrast, some European Tier 3 operations focus on low-volume, high-security custom builds where throughput is lower but certifications and finish are the priority. Our own smart lock manufacturer facility operates with a balanced mid-to-high volume model designed to service both large OEM distributors and agile ODM brand owners.
Factors Influencing Smart Lock Production Scalability
Scalability is not just about adding headcount. It depends on how deeply the factory controls its core electronics and how it manages material lead times.
Technological Infrastructure (SMT and Assembly)
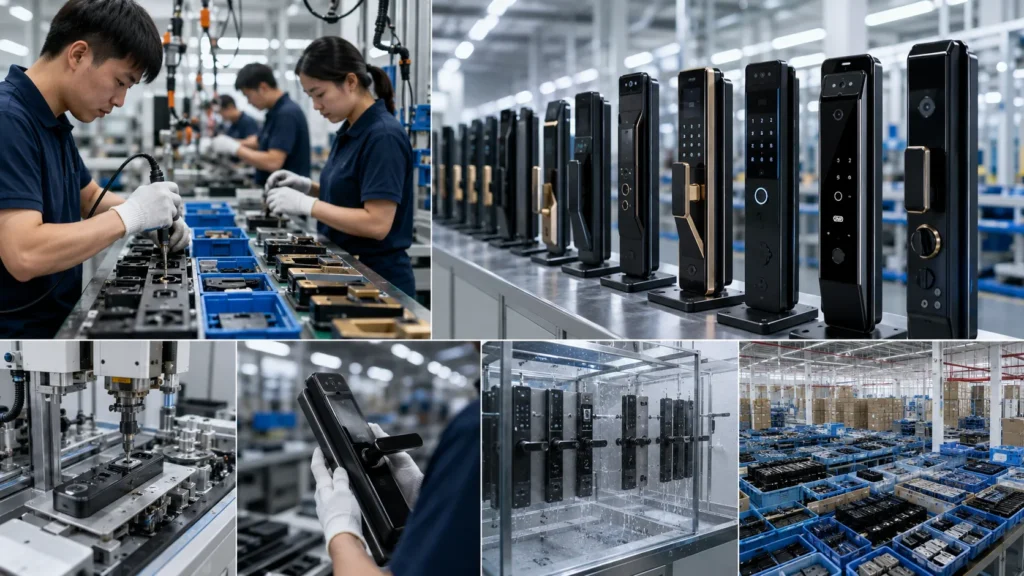
In-house SMT (Surface Mount Technology) lines are the single biggest technical lever for production scalability. Factories that run their own SMT placement, reflow soldering, and automated optical inspection (AOI) can compress PCBA lead times, reduce defect rates, and avoid the queue variability of outsourced PCB fabrication. A typical high-capacity line may produce 30,000–50,000 PCB assemblies per month, depending on board complexity.
On the assembly side, automated final-assembly stations combined with semi-automated testing cells keep daily throughput consistent. We find that cell-based manufacturing, where each cell builds a complete module, reduces WIP and makes scaling more linear.
Hardware Complexity and PCBA Lead Times
Not all smart locks are equal on the production floor. A basic PIN-only lock with a single PCB might take seconds at final test. A biometric smart lock production unit with fingerprint or facial recognition sensors requires longer calibration, security provisioning, and environmental testing cycles, which can cut daily output per line by 30–40%. When evaluating an electronic door lock factory, ask for throughput benchmarks by model type, not just a blended average.
PCBA lead times are also sensitive to component supply. Even a factory with 10 SMT lines can be bottlenecked by a single security MCU or capacitive sensor allocation. This is why we bundle material procurement planning into capacity discussions — raw board output means little if critical ICs sit in a 16-week allocation queue.
The Correlation Between Capacity, MOQ, and Lead Times
Larger production capacity tends to pull down MOQs and compress lead times because material procurement is ordered in bulk, production slots are more numerous, and shipping consolidation is easier. However, the relationship is not linear — peak season demand and product complexity can quickly invert these advantages.
| Capacity Tier | Typical Lead Time (Standard Order) | Typical MOQ | Peak Season Risk |
|---|---|---|---|
| Tier 1 (3M+ units) | 25–40 days | 500–1,000 units | Moderate; built-in buffer stock |
| Tier 2 (500K–2M) | 35–55 days | 1,000–3,000 units | Higher; limited line flexibility |
| Tier 3 (Under 500K) | 50–75 days | 2,000–5,000 units | Significant; vulnerable to batch scheduling |
Note: Lead times vary by model complexity, component availability, and customization depth. Confirm current schedules before placing orders.
Peak season (commonly Q3 for hospitality and back-to-school promotions) can stretch these benchmarks by 15–25 days. Buyers sourcing at scale should discuss reducing lead times in smart lock production through advance material reservation or buffer stock agreements, which higher-capacity suppliers can often support.
Verification Checklist: Auditing a Supplier’s Stated Capacity
Buyers must distinguish between installed capacity (theoretical maximum) and effective capacity (actual sustainable output). We recommend requesting these concrete verification points before signing a supply agreement.
- Request ISO 9001 and factory audit reports: Quality management systems give indirect but reliable evidence of process stability. Look for audit frequency and non-conformance closure rates, not just the certificate.
- Verify square footage against production data: A 5,000 m² facility claiming 1 million units annually should raise flags. Cross-reference floor layout, warehousing ratio, and the actual number of active SMT lines and assembly cells.
- Review past shipping records: Ask for bill-of-lading summaries or shipment logs from previous high-volume quarters. This reveals whether the factory has actually delivered at the scale you require.
- Assess R&D to production ratio: Facilities that dedicate too much space to prototyping and too little to production lines may struggle with repeatability. A healthy balance is typically 15–25% of floor area for R&D and QC labs.
- Compare theoretical vs. effective capacity: Factor in maintenance downtime, shift changeover, and rework losses. Even a well-run facility rarely sustains above 85% of its theoretical maximum.
Buyer’s note: When a supplier quotes a headline capacity figure, ask for the methodology. Is it 24/7 operation, 7 days a week? Does it count all SKUs equally? Understanding these assumptions is part of a thorough OEM lock manufacturing evaluation.
Request a Factory Audit and Capacity Analysis
Scaling a smart lock brand requires a production partner whose effective capacity aligns with your growth trajectory. We offer detailed manufacturing capability documentation and factory audit support for qualified buyers.
Submit your annual volume requirements, target SKU mix, and any certification needs through our inquiry form. Our team will provide a tailored capacity analysis, including projected lead times, MOQ recommendations, and a review of our cost-effective wholesale options. For buyers evaluating smart door lock China sourcing, we can also schedule a virtual or on-site factory tour to verify our production lines and QC protocols directly.
Frequently Asked Questions
How does smart lock complexity affect daily unit output?
Biometric models, especially those with facial recognition and live fingerprint capacitance sensors, require longer calibration and security provisioning during final assembly. This can reduce per-line daily output by 30–40% compared to simple RFID or PIN-code locks that need only a quick electronic functional test. Always discuss output forecasts by model category rather than assuming a flat rate.
What is the typical lead time for an OEM smart lock order?
For a standard OEM order without major hardware redesign, industry lead times typically range from 30 to 60 days. This includes PCBA fabrication, firmware loading, assembly, QA, and shipping preparation. Orders involving biometric smart lock production or custom housings may add 2–4 weeks. Material availability, particularly chipset lead times, remains the largest variable.
Can a manufacturer increase capacity for seasonal spikes?
Yes, most factories use a combination of flexible labor, overtime shifts, and pre-built buffer stock. However, sustained capacity increases require additional production lines and SMT investment. Before relying on surge capacity, buyers should confirm what percentage of the spike can be absorbed through shift adjustments versus what must be ordered early with buffer inventory. A high security smart lock supplier with deep component stockpiles can often handle spikes more smoothly.